
Always On availability groups are automatically monitored by SQL Governor on all instances that have been added to the proxy. When you open the Monitoring > Availability Groups page, you should see something like this:
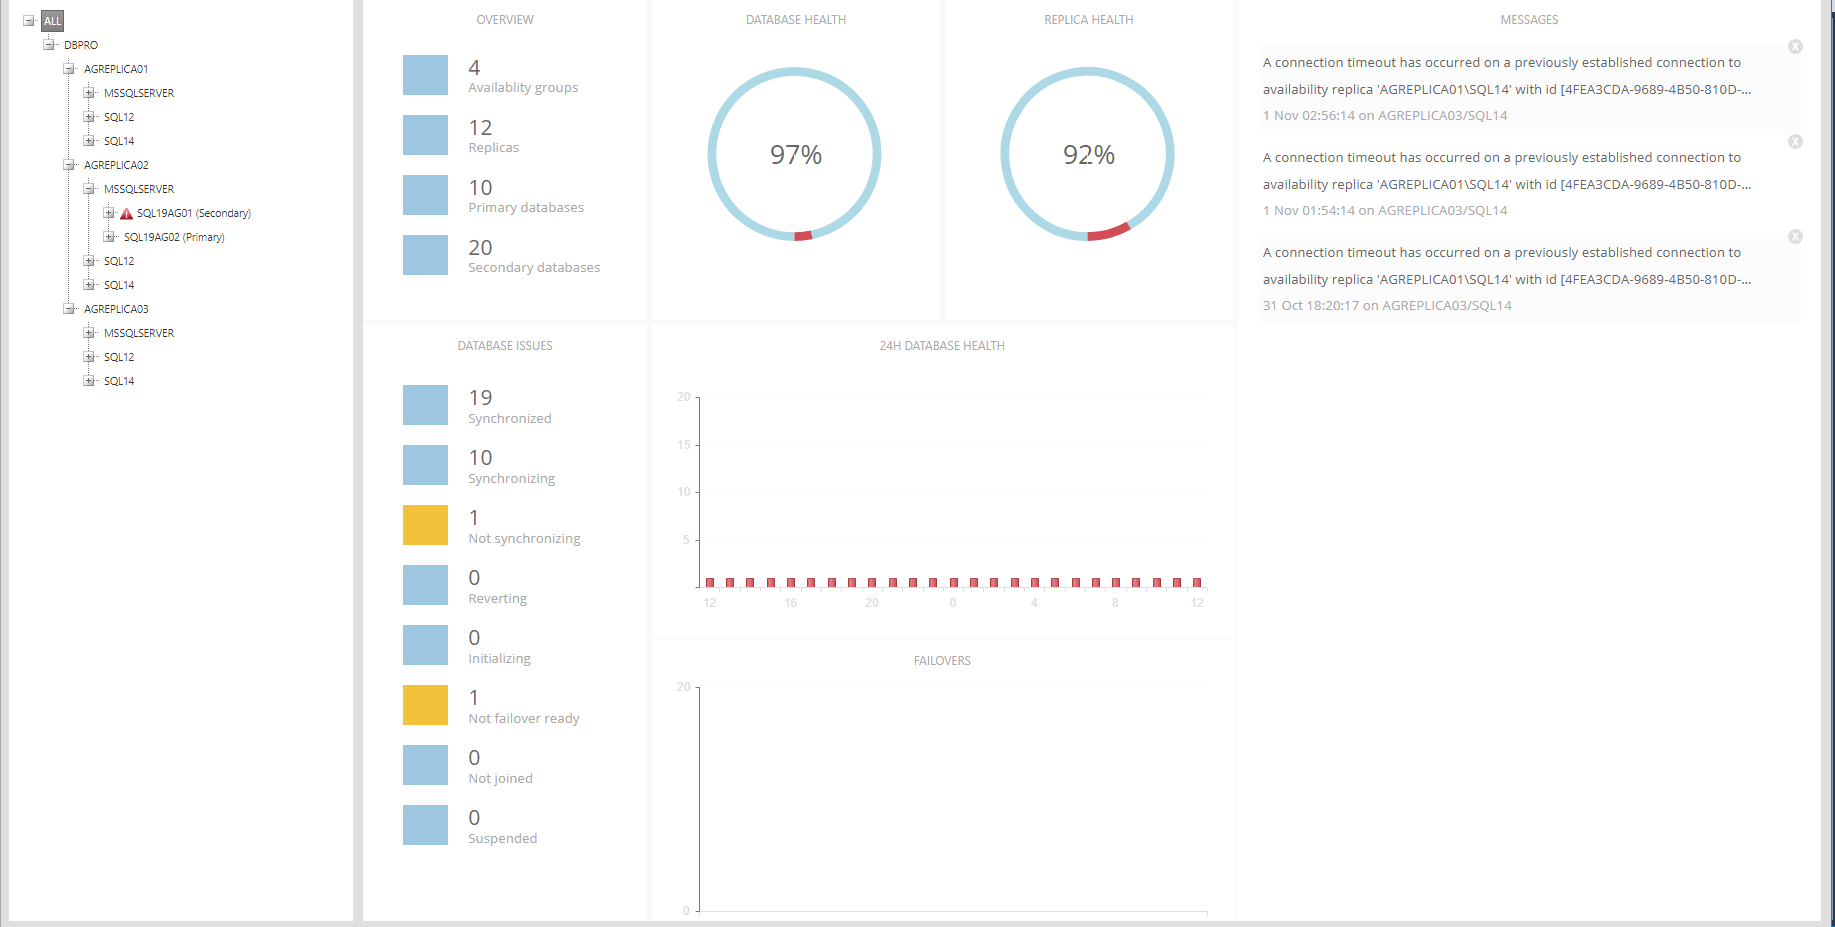
On the left is a tree with domains, servers, instances, availability groups and their databases. Availability groups are shown for each replica with its role in parentheses:

In the example above AGREPLICA01\MSSQLSERVER is the primary replica in the group SQL19AG01, and the group's secondary replica is AGREPLICA02\MSSQLSERVER. If one of the replicas has a warning or an error, a yellow or red triangle is shown next to it.
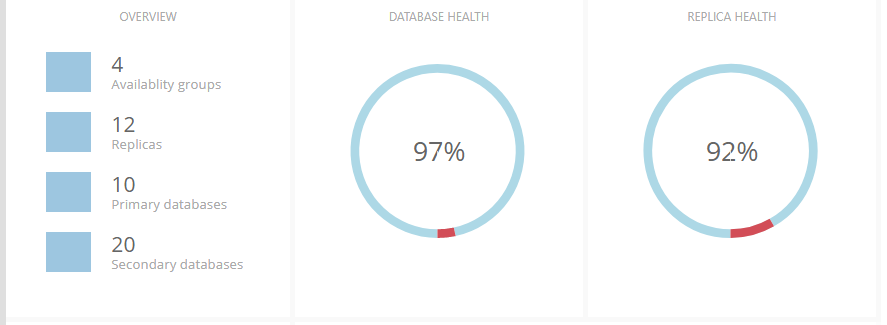
On the right is an overview of the entire system. The top left panel shows how many availability groups, replicas and databases there are. The next two panels show the percentages of healthy (blue), partially healthy (yellow) and not healthy (red) databases and replicas:
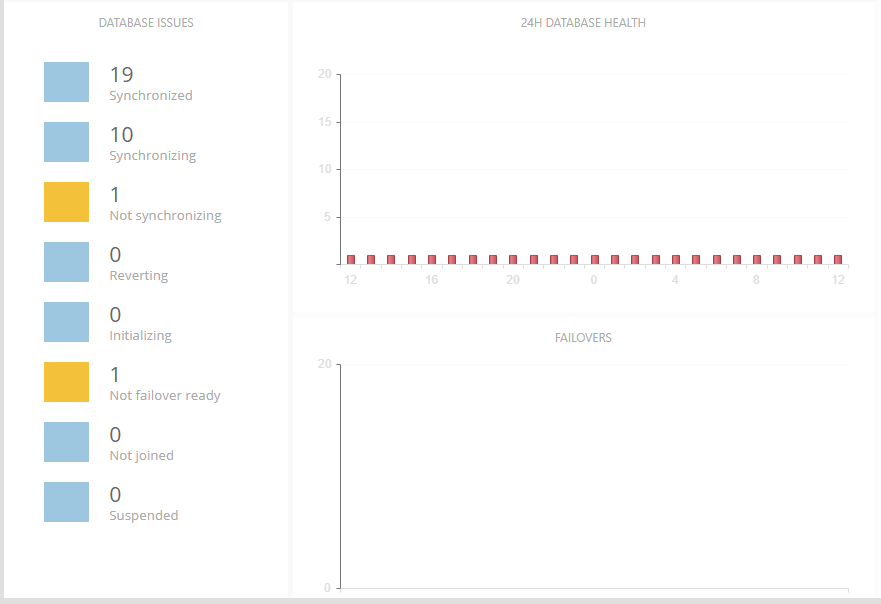
Below these panels on the left is a list of ongoing database issues, with problem statuses shown in yellow. On the top right is a 24-hour view of database or replica health (right-click to change between the views), and on the bottom right a 24-hour view of failovers:
Finally, on the right side of the page is a list of error messages from all availability groups, ranked from the latest to oldest. Messages can be closed by clicking on the small X in the upper right corner.

All availability group data is updated every 2 minutes, with the page auto-refreshing every 30 seconds.
Clicking on an availability group in the tree will show information about the group, its listeners, replicas and databases:
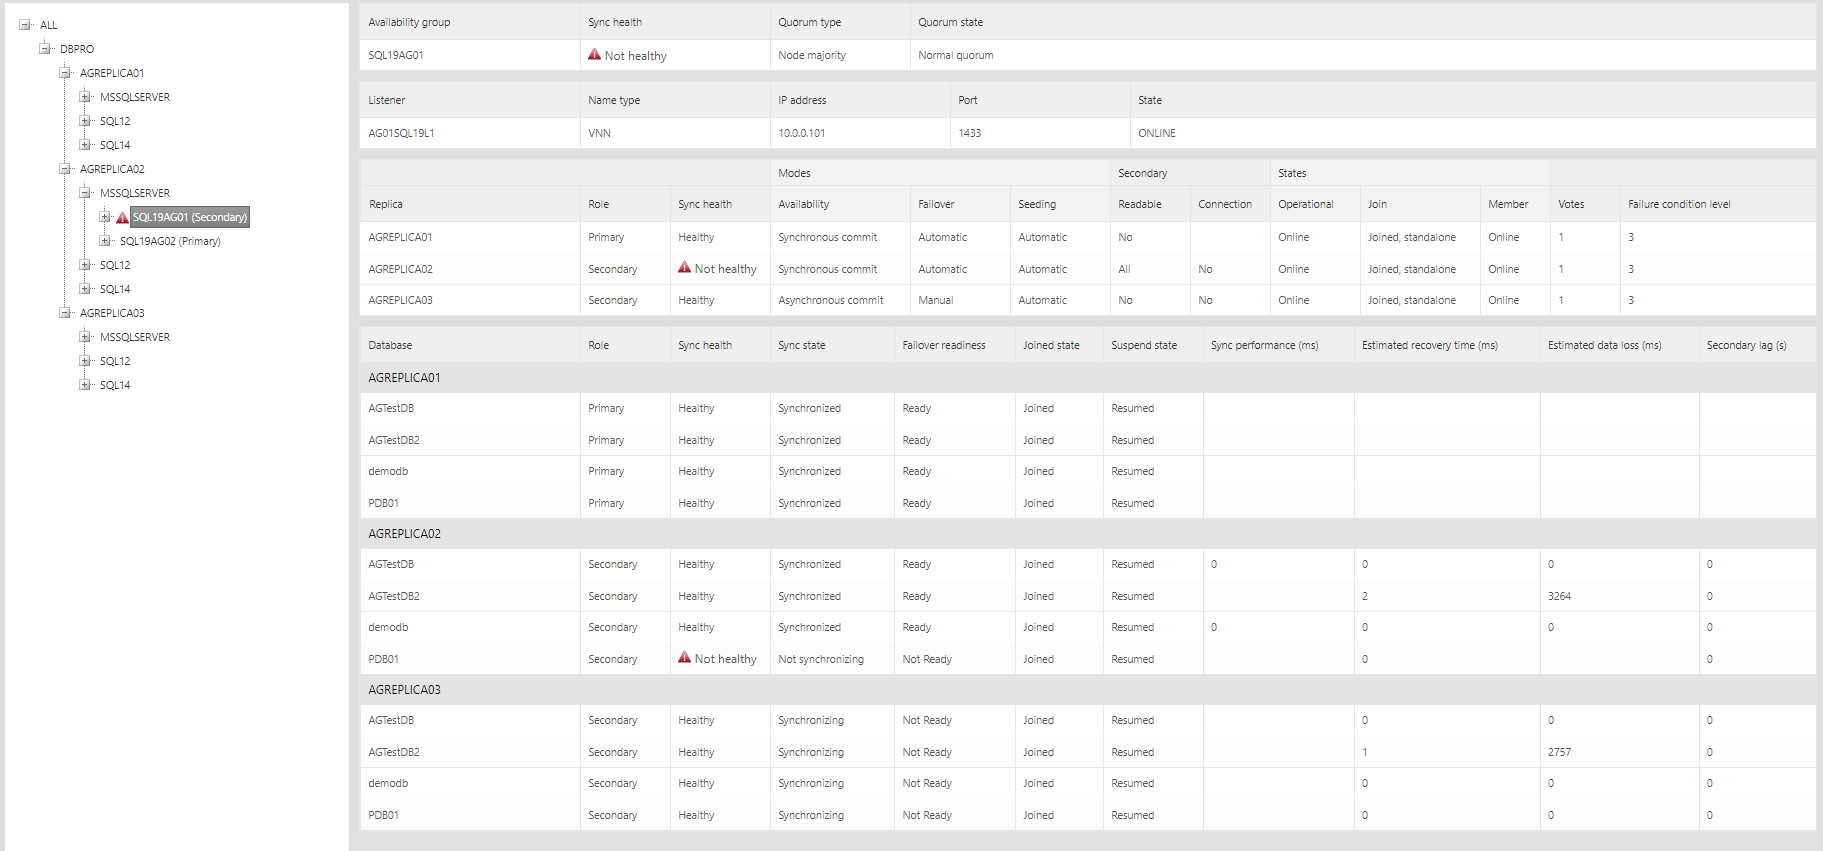
For replicas, information such as synchronization health, availability mode, failover mode and operational state is shown. For databases, a similar set of states is shown, along with four performance counters. Databases can be filtered by clicking on a replica (shows databases belonging to that replica only) or a database (shows only that database for each replica).
Warnings and alerts are shown with a yellow or red triangle:

Clicking on a database in the tree will show state information and performance counter data related to that database:
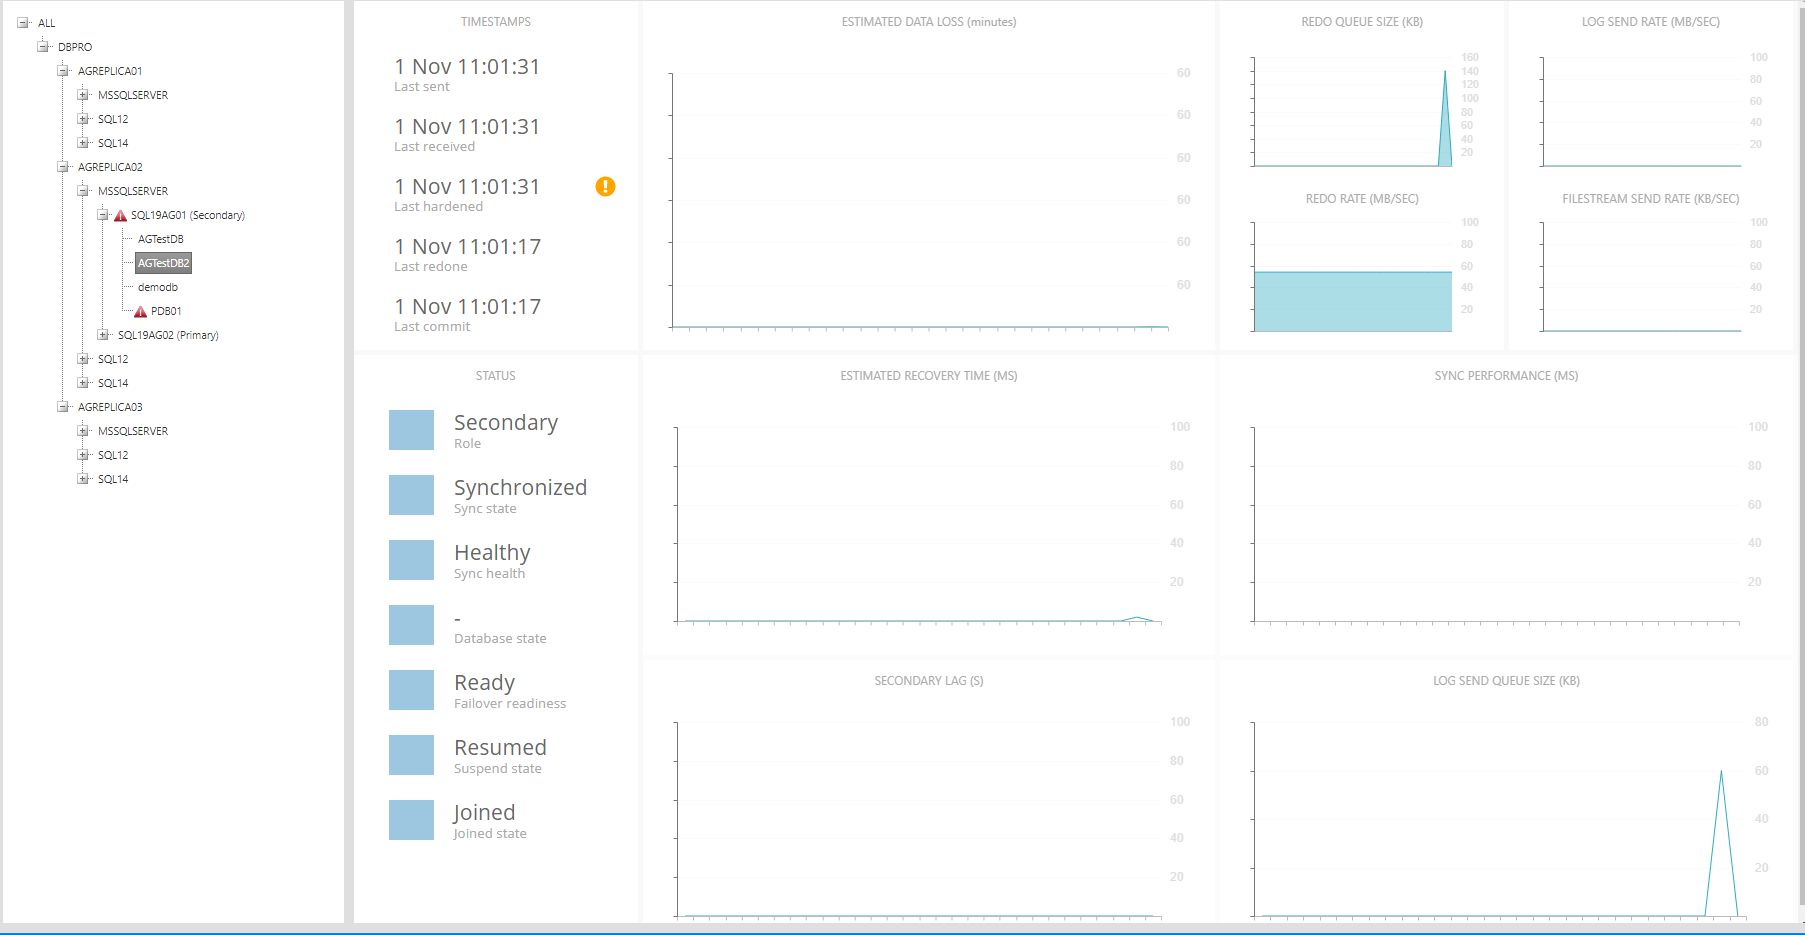
On the top left, a set of timestamps is shown: last sent, last received, last hardened, last redone and last commit. For primary databases, only last commit has a value. For secondary databases, if last commit time is earlier than last hardened time, a yellow warning sign is shown:

On the bottom left, the database's current status is shown. Problematic statuses are shown in yellow.

On the right is a set of nine performance counter charts: estimated data loss, estimated recovery time, secondary lag, sync performance, log send queue size, redo queue size, redo rate, log send rate and filestream send rate. For primary replicas, these charts will be empty.

All charts show one hour of the latest data collected at a 2-minute interval, i.e. 30 data points. The charts, as well as the database states, refresh automatically every 30 seconds.