
Plan cache analysis is visible on the Monitoring > Plan cache page. SQL Governor automatically collects plan cache data from all instances being monitored. With plan cache analysis, it is easy to find which queries are using the most resources in your environment.
When you open the page, you will see the default overview that should look something like this:
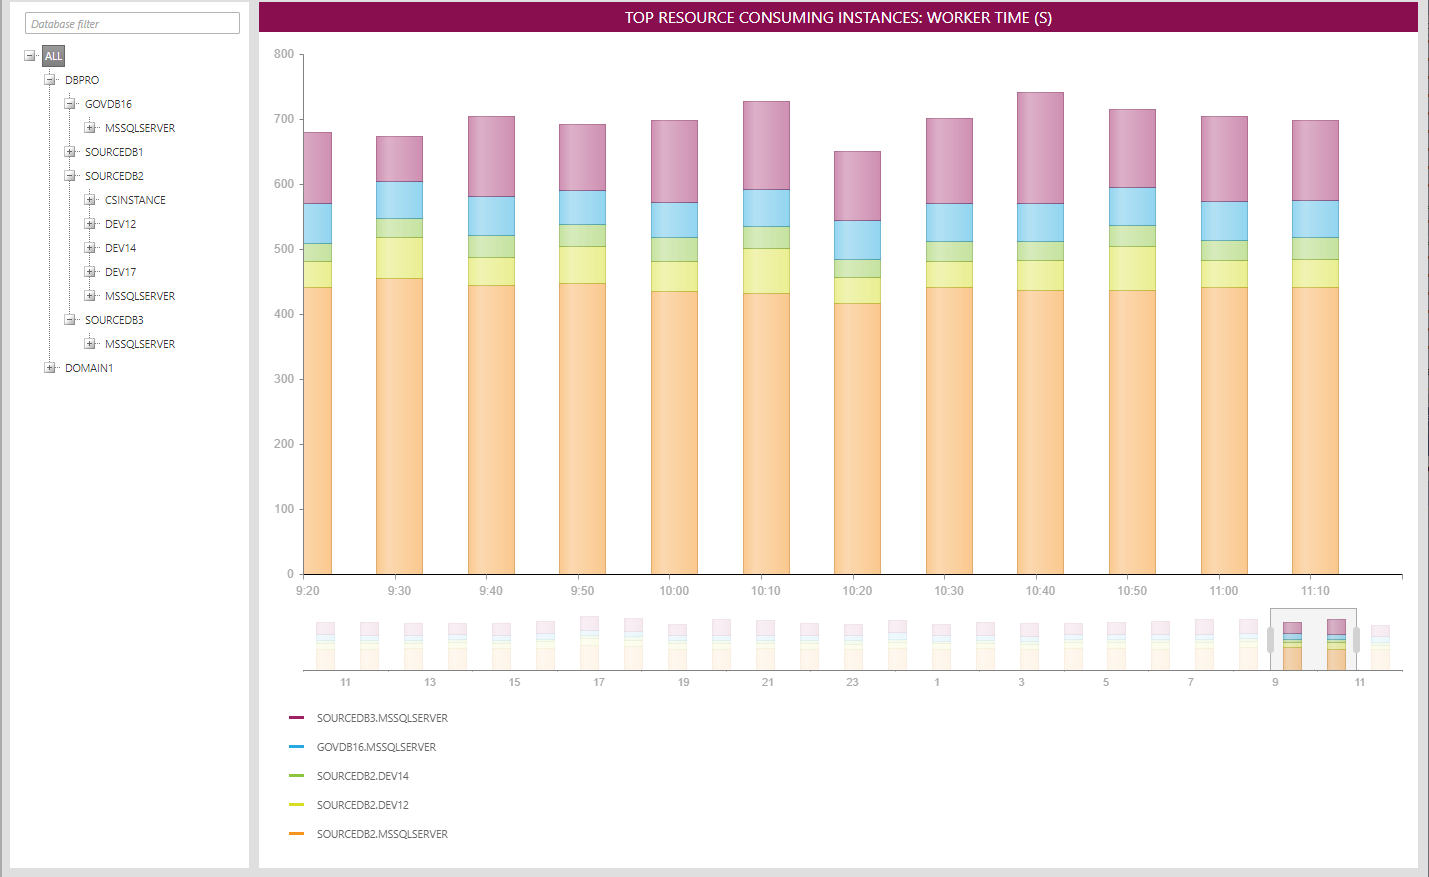
Here, the top 5 resource-consuming instances in your environment and their worker time usage are shown. Each column represents the total worker time (in seconds) of an instance during a 10-minute time period. You can change the measure from worker time to something else by right-clicking on the chart and selecting a different measure from the menu:

When you select an instance or a database node from the tree, the view will change to display the top 5 resource-consuming batches on the selected node:
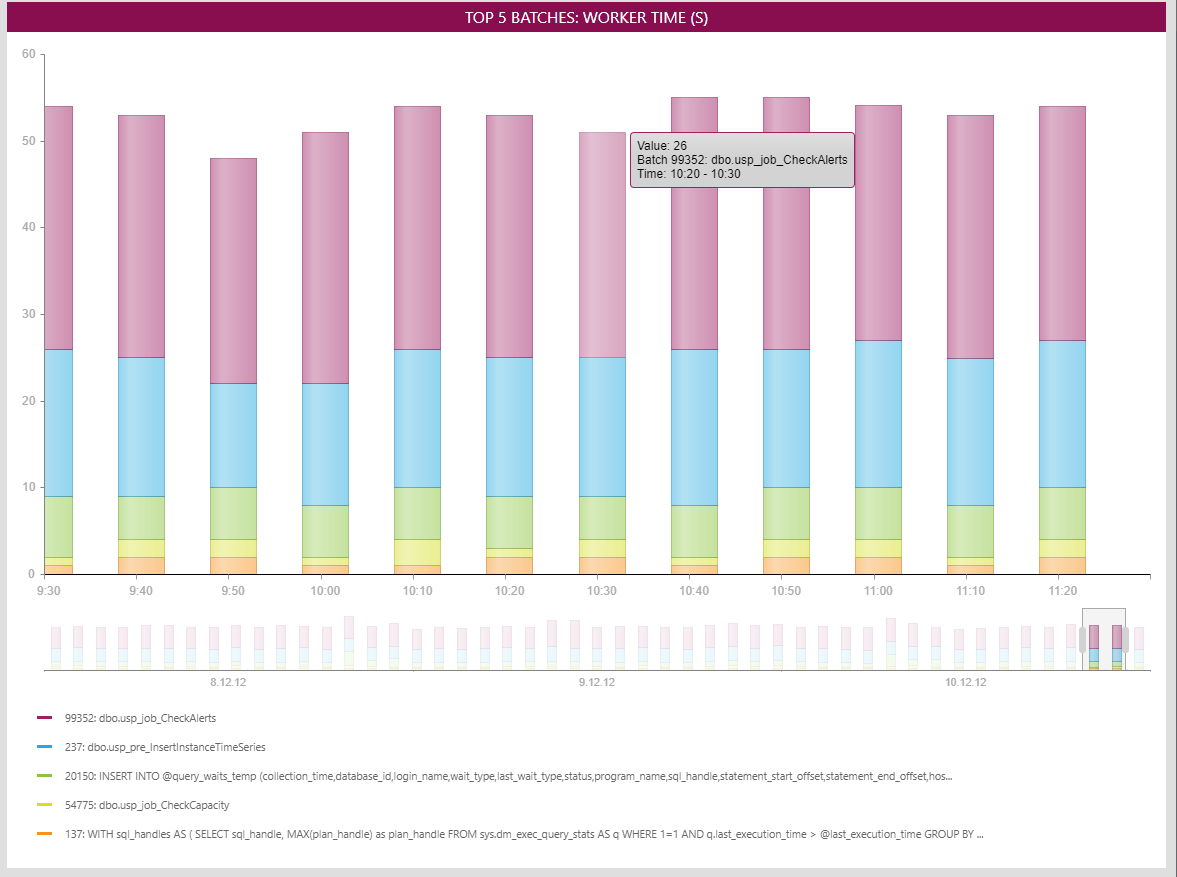
Each stacked column represents the total measured values of all five batches in a 10-minute period, while each colored column in a stack represents the measured value of a single batch. The legend at the bottom shows the associated column color, an internal batch identifier and either the stored procedure name or the beginning of the ad hoc query.
The tooltip over each column shows the recorded value, the name of the batch and the time period. For example, the above tooltip shows that the batch usp_job_CheckAlerts used 26 seconds of worker time between 10:20 and 10:30.
Clicking on a column (i.e. batch) will drill down to the top 5 resource-consuming statements inside the batch:

Now each colored column represents a statement inside the batch. The legend at the bottom shows the start offset of the statement and the beginning of the statement SQL text. Drilling down further from the statement chart will display the full SQL batch text with the clicked statement highlighted in blue:

Right-clicking and selecting "Back" from the menu will take you to the previous view.