
Blocked query analysis is visible on the Monitoring > Blocks page. SQL Governor. Blocks are not automatically collected, so they have to be enabled separately for each instance by right-clicking on an instance in the tree and selecting Collect blocks from the menu:

When you open the page and have already enabled block collection, you will see the default overview that should look something like this:
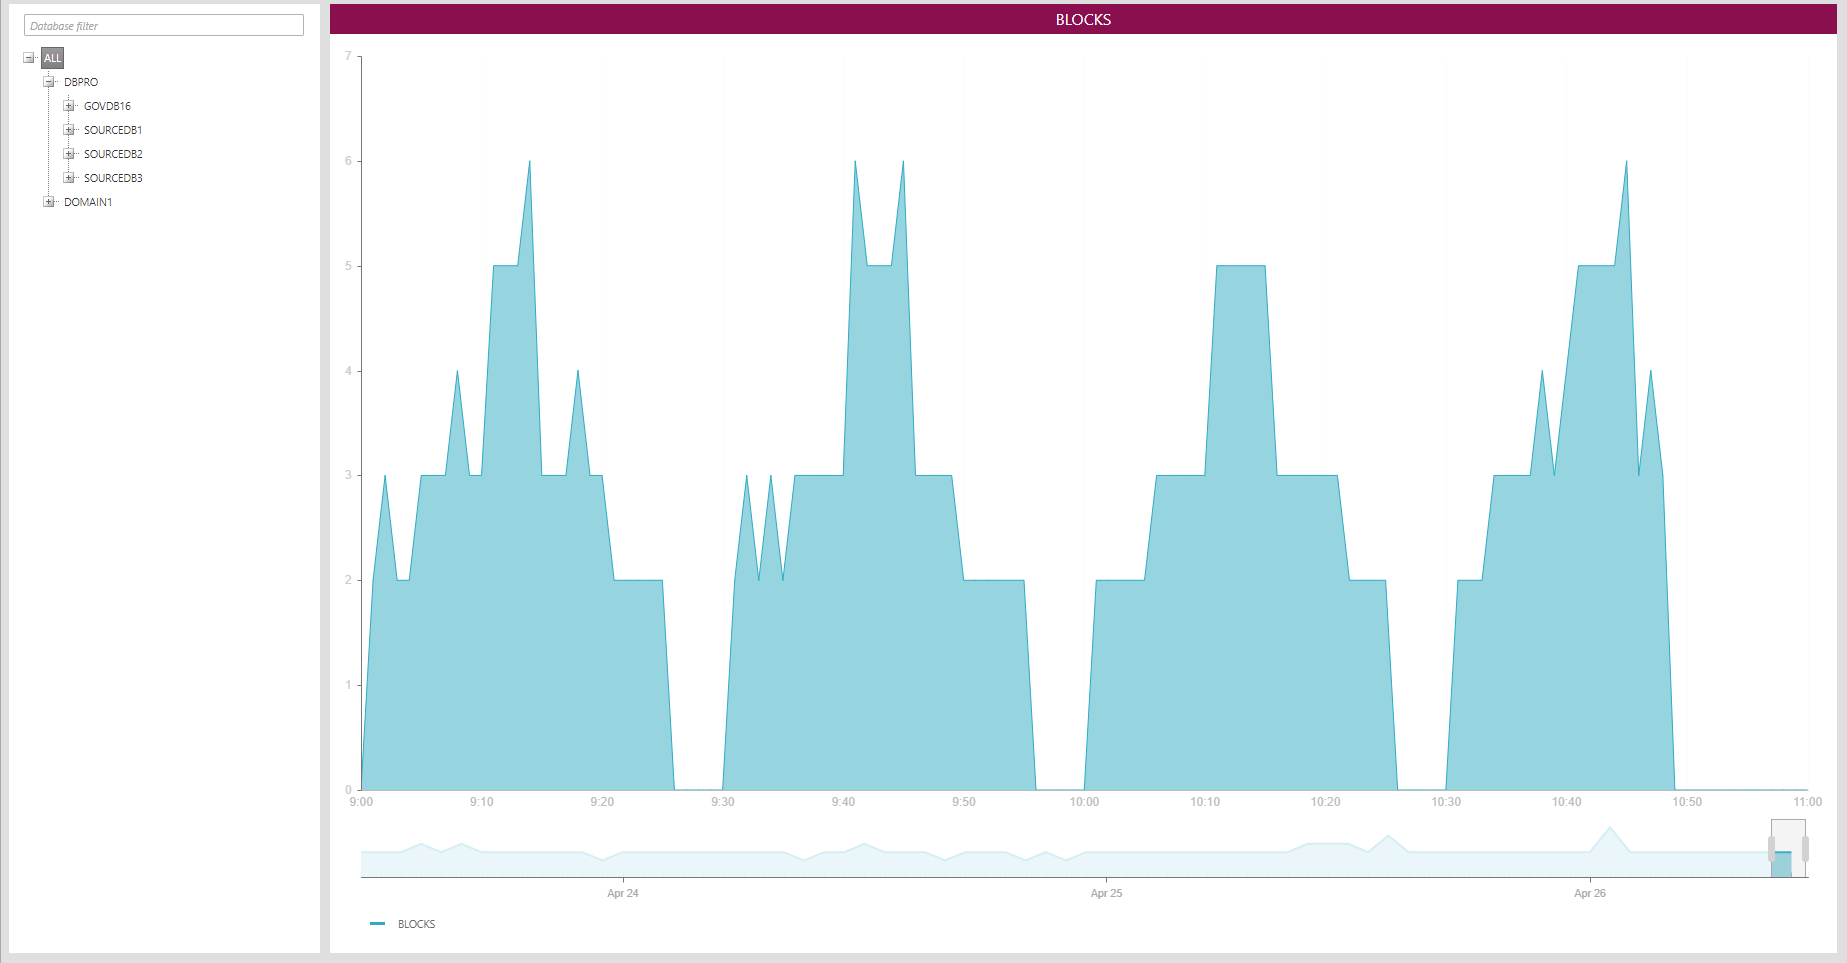
The overview shows the number of blocks for each minute in the entire system. By right-clicking over the chart, you can change the view from the number of blocks to total wait time (seconds) per minute:

To see the actual queries that caused the blocks, first select and instance from the tree and then click on a point in the chart:

In the above chart, the data point at 9:47 AM was clicked, so we will see the a of blocked and blocking queries at 9:47 AM along with their wait times and wait types:

The rows are ordered based on the start time of the blocking SQL. If the query in question was a procedure or a function, its name will be shown on the Object row; for ad hoc queries this will be empty.
Clicking on a row will bring up a tooltip with the full SQL batch texts with the blocked and blocking statements highlighted in red:

Clicking outside the tooltip will close it. To get back to the chart view, click on any node in the tree.