
After SQL Governor has been installed and the proxy has been collecting data for a while, you should check that everything is working fine on the Monitoring page. By default, you see the monitoring overview which should look something like this:
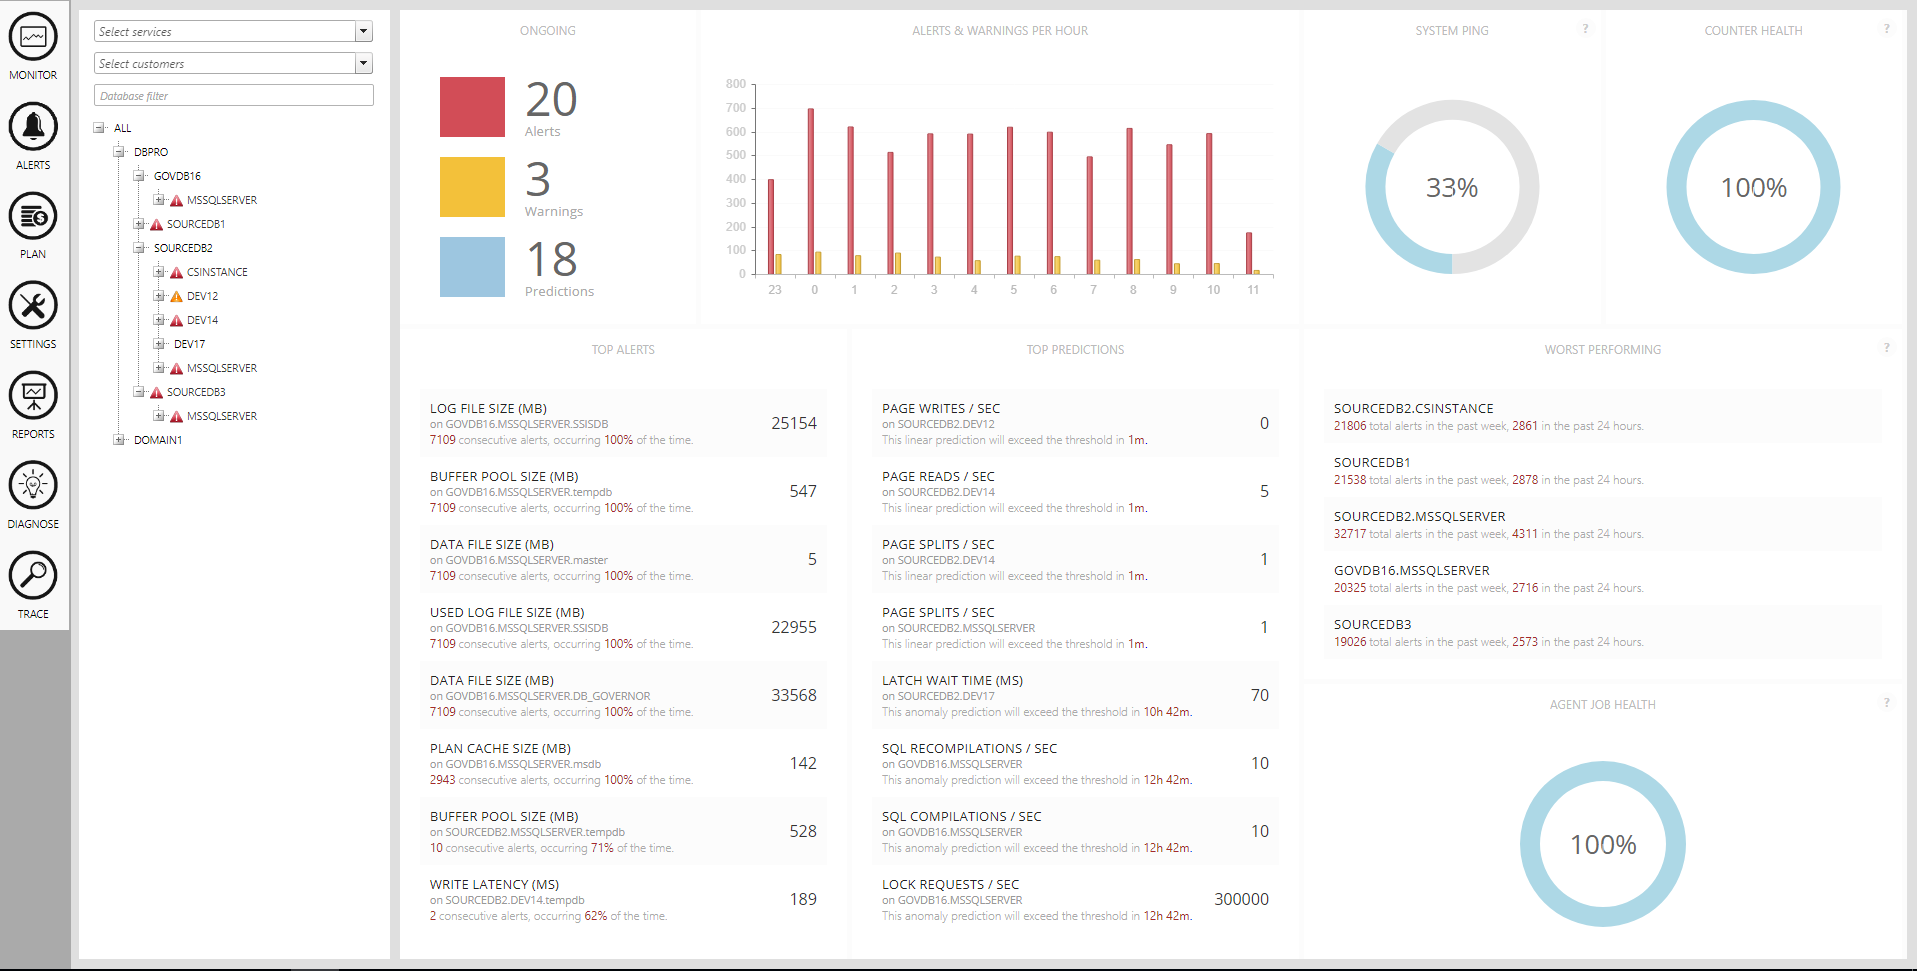
The overview contains eight panels which give you information about the environment being monitored and SQL Governor itself. The first two panels look like this:

The ONGOING panel shows a real-time view of currently ongoing alerts, warnings and alert predictions. Hovering the mouse above the colored squares will show you a list of each. The ALERTS & WARNINGS PER HOUR panel shows a summary of alert and warnings counts per hour from the past 12 hours.
Under these two panels are two more panels showing a more detailed list of ongoing alerts:

The TOP ALERTS panel shows the top 8 alerts, sorted by how often they occur. For each alert, the following information is shown:
| PERFORMANCE COUNTER NAME | |
| NODE NAME | COUNTER VALUE |
| NUMBER OF CONSECUTIVE ALERTS, PERCENTAGE OF OCCURRANCE |
The TOP PREDICTIONS panel is similar, except that for each prediction, the information shown is:
| PERFORMANCE COUNTER NAME | |
| NODE NAME | ALERT THRESHOLD |
| TIME LEFT UNTIL ALERT THRESHOLD IS EXCEEDED |
Clicking on any row in the lists will take you directly to the alert in question.
The two panels in the top-right corner are SYSTEM PING and COUNTER PING:

SYSTEM PING shows you how many nodes are still sending data via the proxy. If this value is less than 100%, it means some servers, instances or databases are not sending data properly, These nodes are shown in a grey color in the tree. Possible reasons are problems with permissions and firewalls, offline instances or databases and issues with proxy configuration. To find out the root cause, check the proxy log file for errors.
COUNTER HEALTH shows the percentage of nodes that are sending correct counter values. Incorrect counter data may occur when performance counters are broken on the source servers, in which case they need to be rebuilt. If this value is less than 100%, check the proxy log file for errors.
Under these panels is the WORST PERFORMING panel:
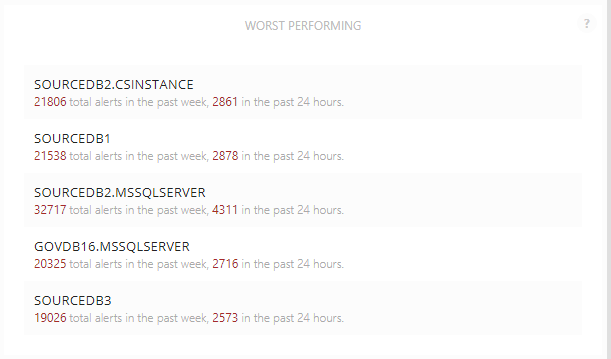
This panel shows you the top 5 nodes which are causing and have caused the most alerts in your environment, regardless of the performance counter. In the example above, the CSINSTANCE on the SOURCEDB2 server has caused the most alerts in the past week and still has at least one active alert. Clicking on a row will take you directly to the node in question and show the first active alert.
The last panel is AGENT JOB HEALTH:

Hovering the mouse over the gauge will show a list of all SQL Server Agent jobs running on the SQL Governor server and whether they succeeded or failed. If this value is less than 100%, you should investigate the failed job further.
On the left, you should see a tree with all the servers that are being monitored. By expanding a server (clicking on the + sign), you should see a list of all the instances under it. Similarly, by expanding an instance node, you should see a list of databases under it:
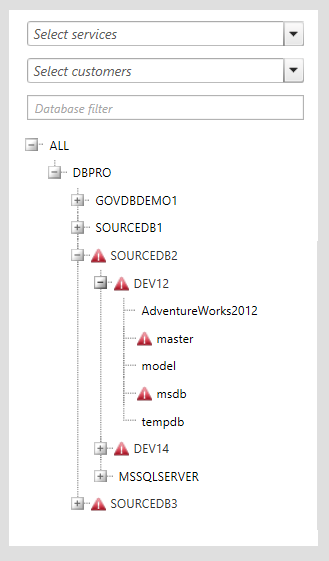
The red triangles next to the nodes mean that an alert has been raised. A yellow triangle means that a warning has been raised. By clicking on one of the nodes, you should see which performance counter(s) caused the alert (or warning):

For example, the above screenshot shows what happens when we click on the instance node CSINSTANCE. Since there is an active alert on the instance on one of the performance counters, we are taken directly to the counter in question, in this case WORKFILES CREATED / SEC. To see what a performance counter means, hover the mouse above the name of the counter on one of the lists. Its description will be shown as a tooltip.
The selected counter is shown in a highlighted color in the category lists below the chart. Clicking on a different instance node will automatically select the same counter. However, if you change from one level to another (say, from an instance node to a server node), you will be taken to the first alerting counter or, if there is no alert, the first counter.
To go back to the overview, click on the ALL node in the tree.