
Volume analysis is visible on the Monitoring > Volumes page. Volume information is automatically collected for every server. When you open the page, you should see something like this:
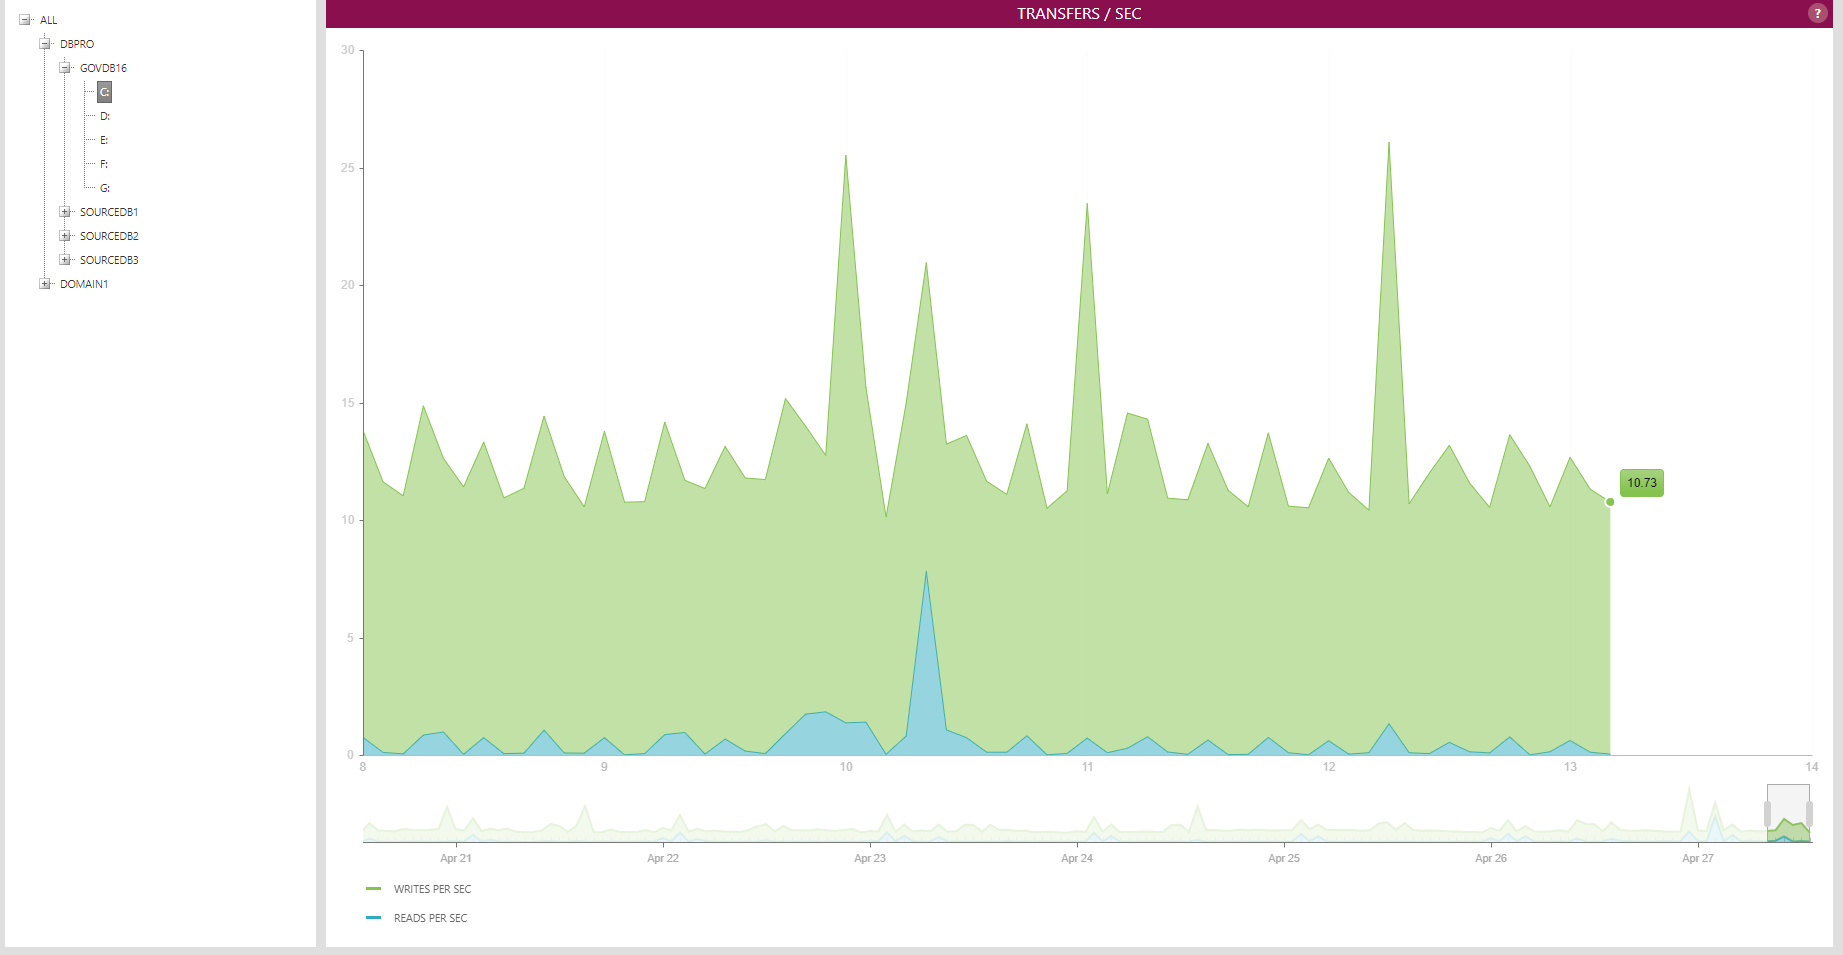
By default, the first server in the tree is expanded and the first volume of that server is selected. The volume's reads and writes per second are shown in the chart on the right as a stacked area chart. The data is collected and shown at a 5-minute interval.
To change the counter, right-click on the chart and select a different counter from the menu:

The available counters are: transfer / second, milliseconds / transfer, disk time percentage, megabytes / second and used space percentage.